Introduction to Network Analysis
This guide will help you:
- ☞ Visualize network data
- ☞ Measure network data
- ☞ Describe features of network data
Evaluate Data
Download network node and edge data. After downloading each file, open them in Excel and evaluate their content and structure. Use the questions below to guide evaluation.
What does the data appear to describe? When looking at the node and edge data together, what connections does it appear are being made? How does the structure of the data support these connections?
Exercise
As you progress through this guide, think about how to answer these questions:
How do different types of centrality affect your interpretation of the network?
What categories of nodes tend to broker connections in the network (hint: betweenness centrality)? What does this allow you to say about the network?
What nodes have the highest in-degree centrality, out-degree centrality, and closeness centrality? Do the highest ranking nodes for each type make sense given what you know about the network?
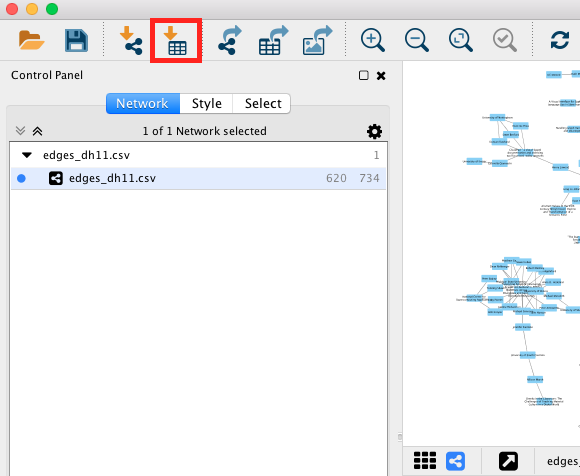
Import Network Data
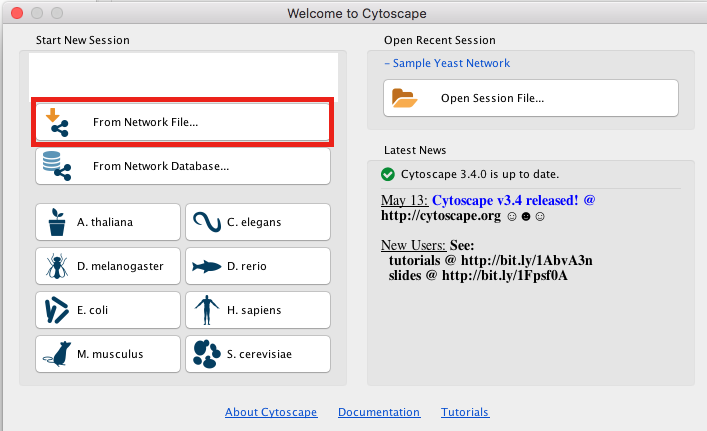
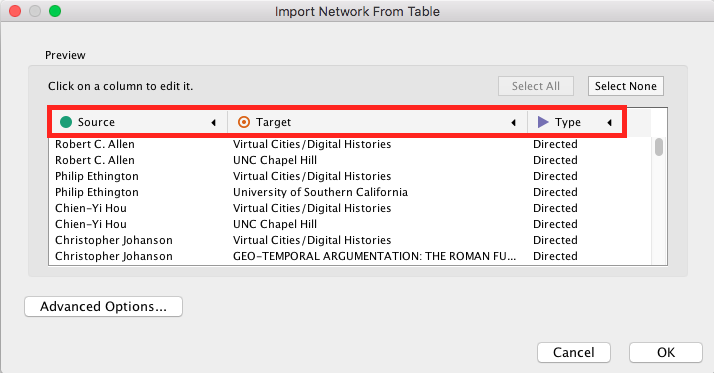
Open Cytoscape and click the 'From Network File' button at the top left of the window. Select and import the edges data.
Hover your cursor over each column header and confirm that the appropriate content types are being recognized by Cytoscape (e.g. source, target, etc.).Click ‘Okay'.
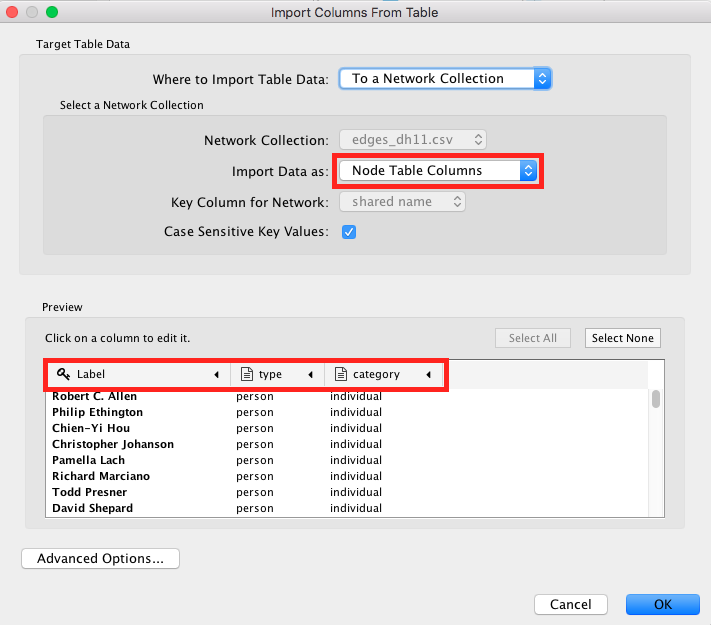
Next, import node data. Near the top left of the primary Cytoscape window, click the 'Import Table from File' button.
Ensure that the 'Import Data as: Node Table Columns' is selected. Hover your cursor over each column header and confirm that the appropriate content types are being recognized by Cytoscape.Click ‘Okay'.
Network metric data generated in the course of this exercise will be added to imported data.This will allow us to visualize and interpret the network data in a variety of ways.
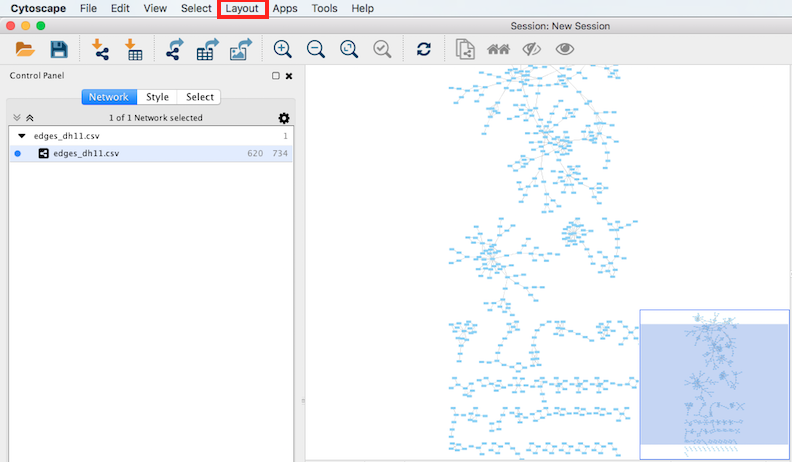
Apply Layout
After importing your network data, you will see the imported data rendered as a network visualization in the primary window. As network data grows in complexity the default visualization becomes fairly useless for exploring the network.
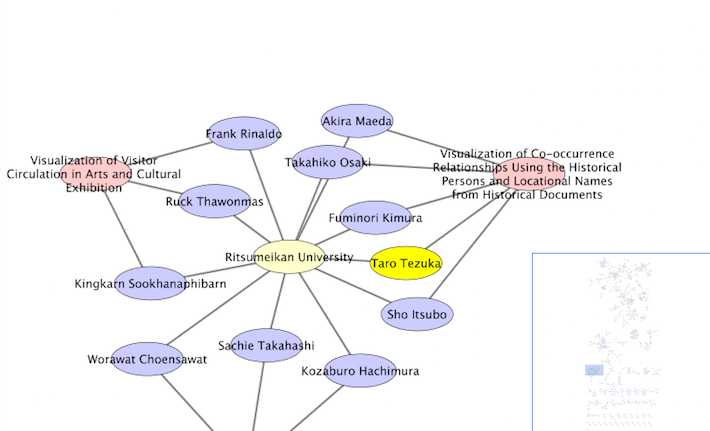
In order to better navigate the data it is possible to utilize a layout from the ‘Layout’ menu, on the left hand side of the screen, to generate a new visualization. Try experimenting with a couple of different layouts until you feel it is easier to interpret the network (e.x. clusters are distinct, nodes do not overlap). Note that some layout parameters can be modified in the 'Layout' menu by following this path - Layout > Settings.
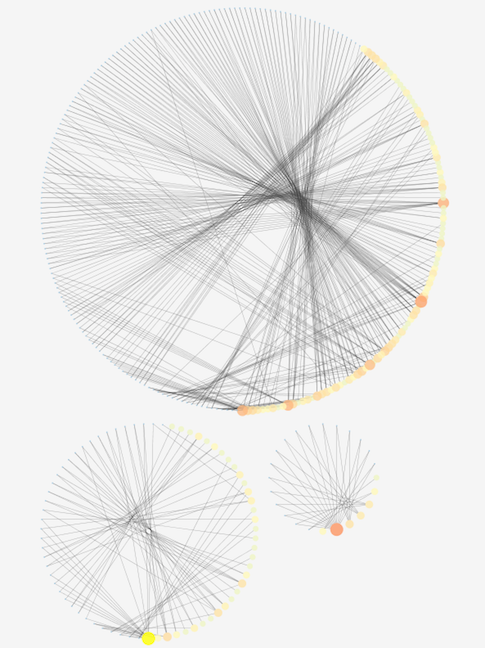
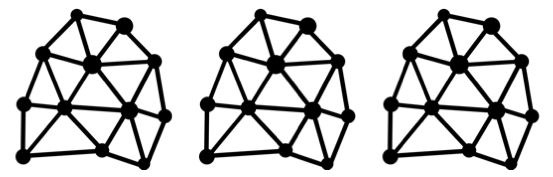
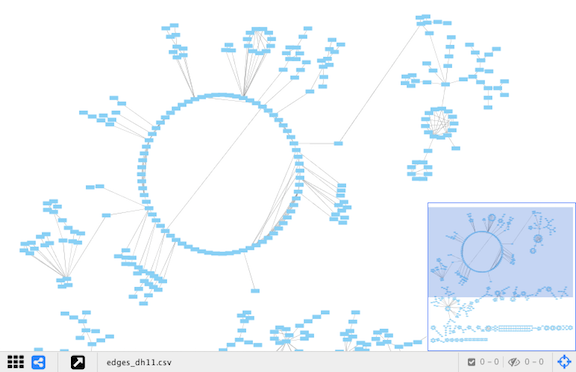
Example - yFiles Layout - Circular
Adjust Nodes
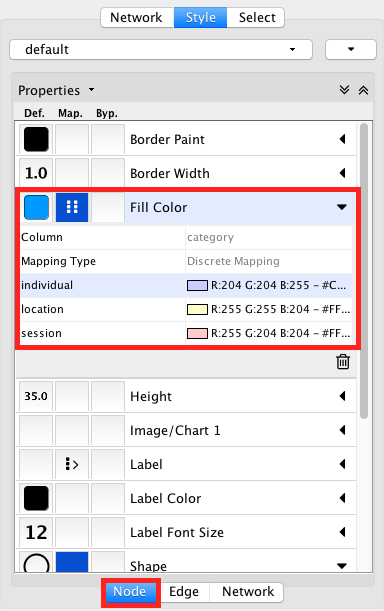
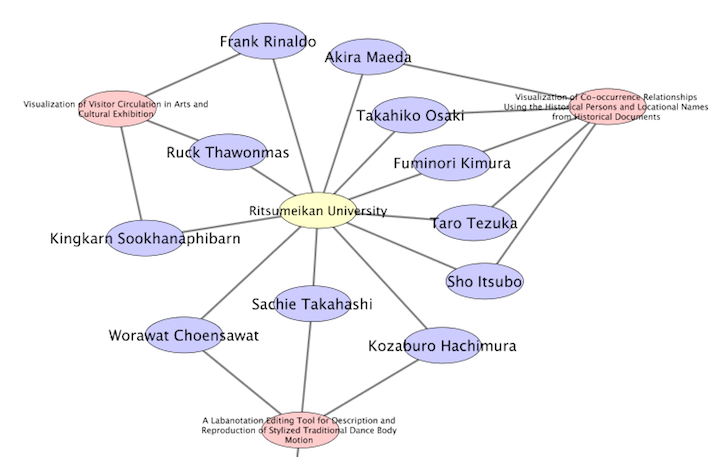
We want to distinguish between the individuals, locations, and sessions in our data. To re-color according to these categories, select the ‘Style’ tab on the top left hand side of the interface, and then the ‘Nodes’ tab located just below that. Click the dropdown for 'Fill Color'. Select 'category' as Column with 'Discrete Mapping' as Mapping type. Manually assign colors to each category. You should see the nodes re-colored according to your choices.
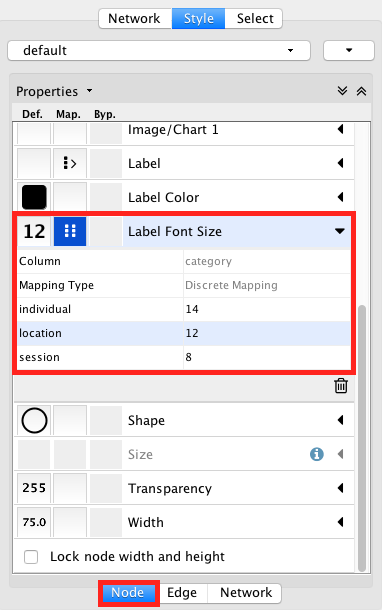
You may also want to manipulate node labels. Click the dropdown for 'Label Font Size'. Select 'category' as Column with 'Discrete Mapping' as Mapping type. Manually font sizes to each category. You should see the nodes re-sized according to your choices.
Measure
At the top of the interface you will find the 'Tools' menu. Within the Tools menu is the 'Network Analyzer'. We'll be using its Network Analysis function to generate metrics that are helpful for analyzing the graph, and for visualizing the graph in different ways. Run 'Analyze Network' by following this menu path - Tools > Network Analyzer > Network Analysis > Analyze Network. When the Network Interpretation Network appears, select "Treat the network as directed" and click 'OK'. A results panel will appear with high level summary of network metrics.
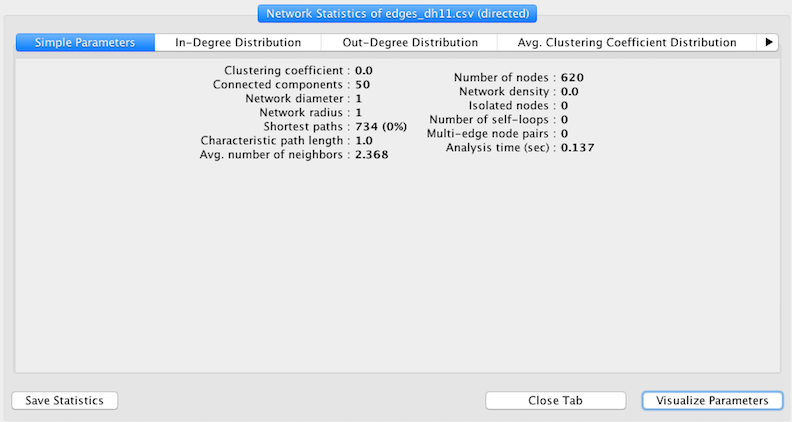
The top of the results panel contains tabs that allow you to drill down to various network metrics. Note the "Visualize Parameters" button at the bottom of the window. We will use this function in the next section.
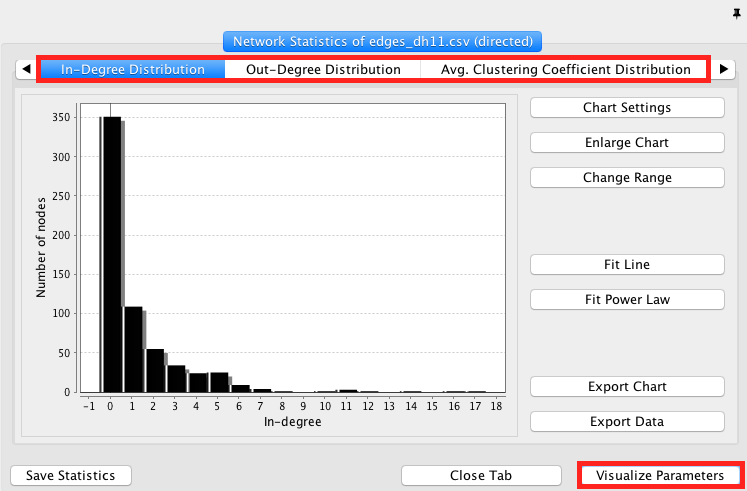
Average Degree - The average number of edges connected to a node In-Degree - number of incoming edges Out-Degree - number of outgoing edges Avg. Clustering Coefficient - Averages how nodes are embedded in their neighborhood Neighborhood Connectivity - average connectivity of all neighbors Betweeness - reflects the amount of control that this node exerts over the interactions of other nodes in the network Closeness - a measure of how fast information spreads from a given node to other reachable nodes in the network Network Diameter - The longest shortest path between nodes within the graph Connected Components - Determines the number of connected components in the network
Utilize Measurement
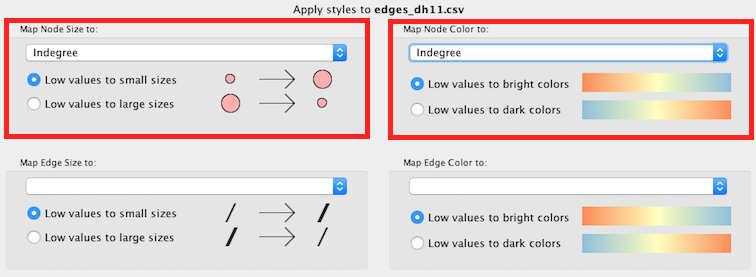
Once you’ve generated metrics, you can apply them to the graph visualization.
The network metrics generated in the prior section can be used to restyle the network. In the below example we draw on the Network Analysis results panel data to style a range of node colors and node sizes according to each node's In-degree value. In addition to In-degree, feel free to restyle according to several or all of the metrics for comparison.
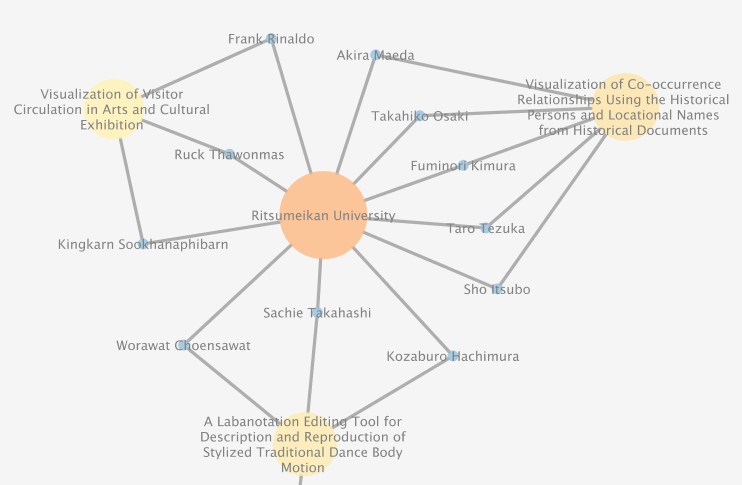
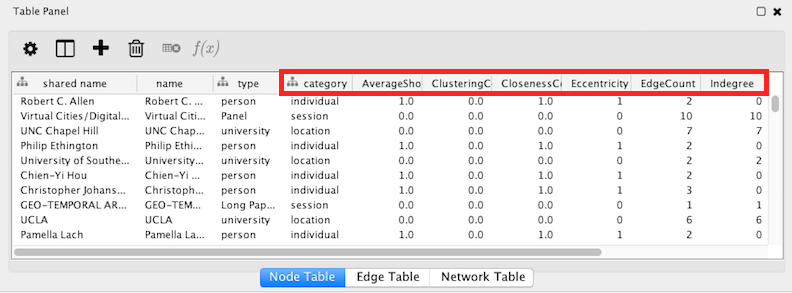
If we turn our attention back to the primary interface, we will note that our node table has been enriched with data generated by the Network Analysis function.
The addition of this data allows us to experiment with network visualization layouts that take them into account. Try revisualizing the network according to layouts that leverage these data - generally layouts that mention 'attributes' or 'edge-weight' will offer this ability.
Example - Attribute Circle Layout - In-Degree